Plot cumulative mean Probabilistic Sensitivity Analysis results
Source:R/check_PSAstability.R
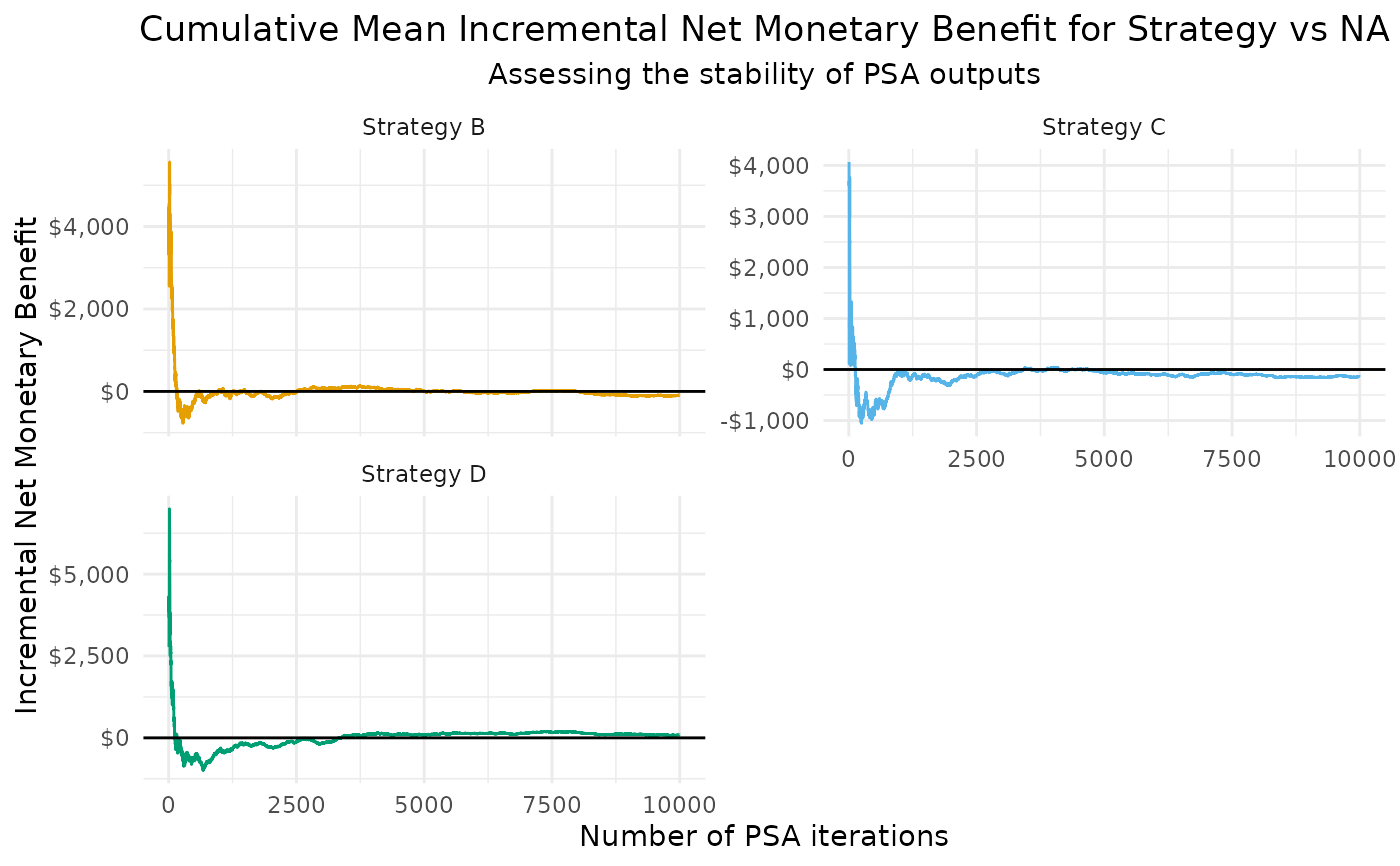
plot_PSA_stability.RdThis function plots the cumulative mean of incremental net monetary benefit (INMB), incremental cost-effectiveness ratio (ICER), incremental costs, or incremental effects for different strategies compared to a specified comparator.
Usage
plot_PSA_stability(
  m_eff,
  m_cost,
  lambda,
  currency_symbol = "$",
  v_strategy_labels = NULL,
  v_strategy_colors = NULL,
  comparator = NULL,
  output = "inmb",
  include_reference_line = TRUE,
  log_x = FALSE
)
Arguments
- m_eff
Numeric matrix of effects for different strategies.
- m_cost
Numeric matrix of costs for different strategies.
- lambda
Numeric value specifying the willingness-to-pay threshold for ICER.
- currency_symbol
String specifying the currency symbol for y-axis labels.
- v_strategy_labels
Named vector of strategy labels e.g. c("A" = "Strategy A").
- v_strategy_colors
Named vector of strategy colors e.g. c("A" = "#665BA6").
- comparator
Column name representing the comparator strategy (e.g. "A").
- output
String specifying the type of plot, limited to: "inmb", "icer", "costs", or "effects".
- include_reference_line
Logical indicating whether to include a reference line.
- log_x
Logical indicating whether to use a logarithmic scale on the x-axis.
Examples
# create example matrices
n_psa <- 10000

m_eff <- matrix(data = runif(n = n_psa * 4, min = 0, max = 1),
                nrow = n_psa,
                ncol = 4,
                dimnames = list(NULL, paste0("Strategy ", c("A", "B", "C", "D"))))

m_cost <- matrix(data = runif(n = n_psa * 4, min = 5000, max = 20000),
                 nrow = n_psa,
                 ncol = 4,
                 dimnames = list(NULL, paste0("Strategy ", c("A", "B", "C", "D"))))

v_strategy_colors <- setNames(object = grDevices::palette.colors(n = ncol(m_eff)),
                              nm = colnames(m_eff))

plot_PSA_stability(m_eff = m_eff,
                   m_cost = m_cost,
                   lambda = 20000,
                   currency_symbol = "\u0024",
                   v_strategy_labels = colnames(m_eff),
                   v_strategy_colors = v_strategy_colors,
                   comparator  = colnames(m_eff)[1],
                   output = "inmb",
                   include_reference_line = TRUE,
                   log_x = FALSE)